Track What Works, Double Down
Stop guessing. Monitor engagement trends and follower growth, see your top-performing content, and make data-driven decisions.
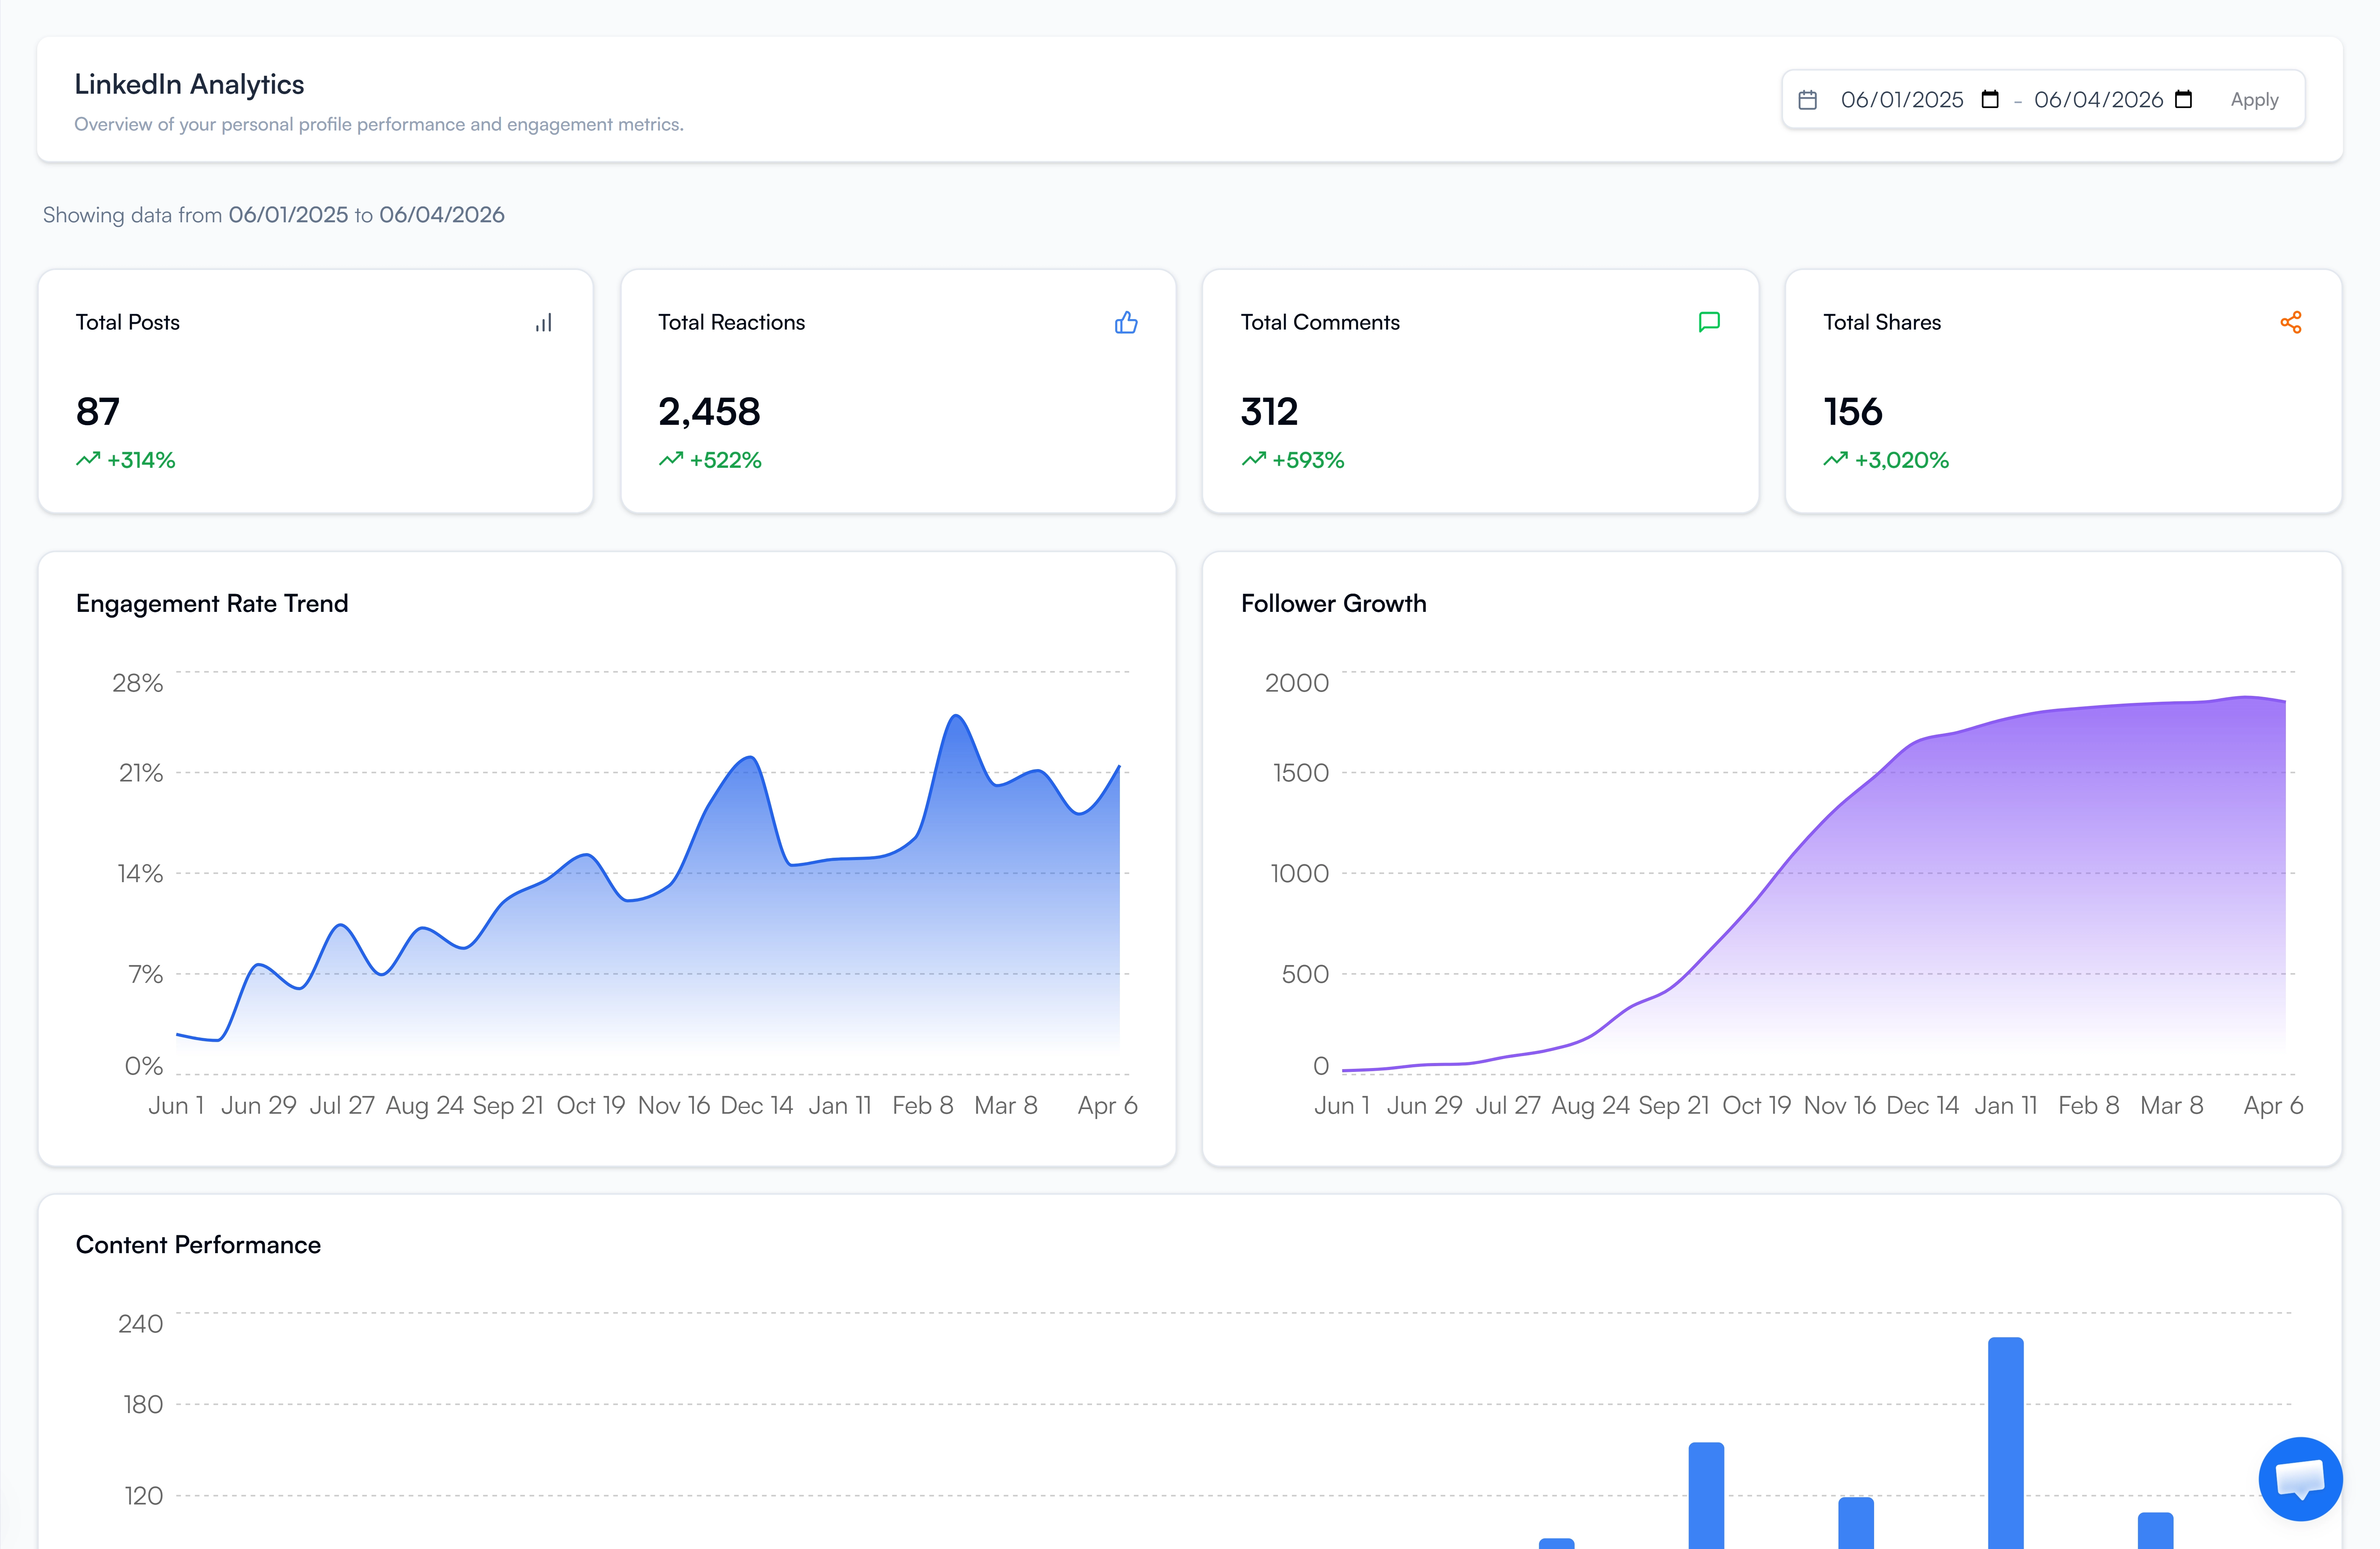
Data-Driven LinkedIn Growth
Stop posting blindly and start making data-driven decisions. The FeedBoss analytics dashboard tracks your total engagement, engagement rate, reactions, comments, shares, and follower growth. Filter by date range, compare periods, and use color-coded indicators to quickly spot what's working and what needs attention. Use insights to refine your Authority Map strategy and double down on high-performing topics with the AI Post Generator.
Key Features
Engagement Tracking
Monitor total engagement, engagement rate, reactions, comments, and shares across all posts.
Follower Growth
Track audience expansion with visual growth trend lines and milestone tracking.
Date Range Filtering
Preset ranges (7, 30, 90 days, yearly) plus custom date selection.
Period Comparison
Compare performance across different time periods to spot trends.
Post Performance
Individual post comparison with color-coded indicators (green for growth, red for decline).
Content Insights
Identify top-performing formats and replicate winning strategies.
How It Works
Open Analytics
Navigate to Analytics in your workspace dashboard.
Filter & Compare
Apply date range filters or compare periods.
Review Metrics
Review metric summaries and interactive charts.
Double Down
Identify top-performing content and double down on what works.
A posting cadence you can actually keep
Posting once is easy. Posting week after week is what grows a presence. The dashboard tracks your cadence and helps you hold it, without turning it into a game you can lose.
Posting cadence
Published posts, last 26 weeks
Quiet milestones at 4, 12, and 26 weeks. A scheduled post counts once it publishes, so a failed publish never costs you a week.
A 26-week heatmap of the posts you actually published, plus this week so far.
A weekly goal you set. It starts at 3, the 2 to 5 per week sweet spot.
Scheduled posts show as projected and count only once they publish, so a failed publish never costs you a week.
Quiet recognition at 4, 12, and 26 weeks. No confetti, no flame to feed.
A kind reminder email on Friday if the week is running behind.
Free on every plan, and shared across your workspace.
Who It's For
Built for LinkedIn creators at every level
Content Creators Optimizing Strategy
Stop guessing what works. See exactly which posts drive the most engagement, identify patterns in your top performers, and double down on the formats and topics that resonate.
Marketing Managers & Agencies
Report LinkedIn ROI with real data. Compare periods, export performance trends, and show clients exactly how their thought leadership is growing over time.
Growth-Focused Professionals
Track follower growth milestones, monitor engagement rate improvements, and set data-backed goals. Know whether your LinkedIn investment is paying off.
Frequently Asked Questions
How often does analytics data update?
What metrics does the Analytics Dashboard track?
Does FeedBoss show impressions or reach?
Do I need to connect my LinkedIn account?
Can I compare my performance across different time periods?
Does FeedBoss track how consistently I post?
What happens to my cadence if I miss a week?
Related Features
Explore more tools in the FeedBoss platform
AI Post Generator
Generate publish-ready LinkedIn posts in single or batch mode with AI that learns your voice.
Learn more →Authority Map
Visualize your content strategy with topic clusters, authority scores, and AI-generated ideas.
Learn more →Content Calendar
Plan and schedule posts weeks in advance, or auto-generate a full month of content in seconds.
Learn more →Popular Posts
Discover viral LinkedIn content trends by keyword, author, or niche and remix winning formats.
Learn more →Ready to own your LinkedIn?
Pick your voice
Set your tone, topics, and style. FeedBoss learns how you write so every post sounds like you.
Generate & customize
Get AI-drafted posts, carousels, and hooks. Edit or publish as-is.
Post & grow
Schedule content, track what works, and watch your audience grow week over week.